[Linux] 手写轻量C++函数性能探查器:CPU占用率&耗时
平时在写C++程序优化性能的时候,经常想知道某些热点函数跑起来到底占用了多少CPU,花了多少时间。Linux中有很多性能探查工具,诸如perf、top等等,但大多数时候只想要测量某个函数或者代码块,用不着特别庞大的工具。查阅一些资料后,笔者写了两个轻量简单的探查器,分别探查代码块的CPU占用率和耗时,记录分享一下。
统计CPU占用率
核心思路
计算某个函数的CPU占用率,可以粗略地理解为计算某个函数占用CPU的时间与CPU在所有进程上花费的时间的比值,这就要求我们要拿到CPU的详细统计信息。Linux在/proc中记录了现成的CPU统计数据。其中/proc/stat中记录了系统启动到现在,CPU在不同“状态”上累计花的时间;proc/self/stat中则包含了当前进程的CPU各项统计数据。读取这两个文件不需要root权限,因此实现起来不会很麻烦。我们需要做的就是解析这两个文件,提取所需的参数即可。
解析/proc/stat
在终端中执行命令cat /proc/stat,可以看到返回结果的第一行通常如下:
cpu 518127 71 120189 7077551 8165 0 48610 0 0 0
这一行的含义是:从系统启动到现在,CPU在不同“状态”上累计花了多少时间。单位是USER_HZ(大多数机器上可以粗略理解成1/100秒,但准确值建议用sysconf(_SC_CLK_TCK)获取)。各列分别对应着不同的字段,字段顺序从左到右一般是这些:
user:用户态时间;nice:用户态时间(跑在低优先级进程上花的时间);system:内核态时间(系统调用、内核代码执行的时间);idle:空闲时间;iowait:等待I/O的时间;irq:处理硬中断的时间;softirq:处理软中断的时间;steal:虚拟化相关的“被偷走的时间”(在虚拟机环境里,CPU去跑别的系统/别的虚拟机了,就像被偷走了一样);guest:跑guest虚拟CPU的时间(虚拟化场景);guest_nice:跑“nice过的guest”的时间;
其中注意guest和guest_nice不少内核/工具口径里会和user/nice存在重复计入的关系,所以最好将其排除。要计算CPU从系统启动到现在花费的所有时间,把这些值求和即可,计算单位均是USER_HZ。
解析/proc/self/stat
终端中执行命令cat /proc/self/stat,能看到如下的返回结果:
76723 (cat) R 52152 76723 52152 34816 76723 4194304 95 0 0 0 0 0 0 0 20 0 1 0 1515316 9162752 418 18446744073709551615 94507585687552 94507585710729 140728218500048 0 0 0 0 0 0 0 0 0 17 1 0 0 0 0 0 94507585726960 94507585728704 94508453613568 140728218505341 140728218505361 140728218505361 140728218509291 0
这里面有非常多字段,但是我们只需要关心下面几个字段:
utime(14):进程在用户态被调度运行的累计时间;stime(15):进程在内核态被调度运行的累计时间;cutime(16):已等待的子进程累计用户态时间;cstime(17):已等待的子进程累计内核态时间;
如果只关心当前进程,那么cutime和cstime是不需要考虑的。由于我实现的是轻量版本,就跳过前面的字段,只考虑utime和stime,对其求和即可,单位也都是USER_HZ。
求差计算
从/proc/stat和/proc/self/stat获取的值都是“从开机/启动到现在”的累计计数,所以要测“某段时间内”的占用,就需要在代码块的开头和结尾做两次采样取差值:
procDelta = procEnd - procStarttotalDelta = totalEnd - totalStartcpuPercent = procDelta / totalDelta * 100
这样求得的cpuPrecent就是代码块的CPU占用率了。
代码实现
摸清楚了原理,代码实现就不难了。笔者把这部分逻辑抽成CpuProfiler类,完整实现如下:
#include <fstream>
#include <string>
#include <chrono>

class CpuProfiler {
public:
    // 开始测量时记录当前进程和系统CPU时间
    void start() {
        lastProcTime = getProcessCpuTime();
        lastTotalTime = getTotalCpuTime();
    }

    // 结束测量时再次读取时间并计算CPU占用率(百分比)
    double stop() {
        unsigned long procTime = getProcessCpuTime();
        unsigned long totalTime = getTotalCpuTime();
        unsigned long procDiff = procTime - lastProcTime;
        unsigned long totalDiff = totalTime - lastTotalTime;
        // 计算占用率百分比
        double cpuPercent = 0.0;
        if (totalDiff != 0) {
            cpuPercent = (double)procDiff / totalDiff * 100.0;
        }
        return cpuPercent;
    }

private:
    unsigned long lastProcTime = 0;
    unsigned long lastTotalTime = 0;

    // 获取当前进程的 CPU 时间(用户态+内核态),单位:时钟节拍
    unsigned long getProcessCpuTime() {
        std::ifstream statFile("/proc/self/stat");
        if (!statFile.is_open()) {
            return 0;
        }

        // 按顺序读取stat文件中的字段
        int pid;
        char comm[256], state;
        statFile >> pid;             // 进程ID
        statFile.ignore(256, ')');   // 跳过括号内的进程名称
        statFile.ignore(1);          // 略过空格
        statFile >> state;           // 进程状态(R/S等)
        // 跳过不关心的项,一直到第13列结束
        long dummy;
        for (int i = 0; i < 10; ++i) {
            statFile >> dummy;
        }

        // 读取第14列utime和第15列stime
        unsigned long utimeTicks = 0, stimeTicks = 0;
        statFile >> utimeTicks >> stimeTicks;
        return utimeTicks + stimeTicks;
    }

    // 获取系统总的 CPU 时间(所有CPU核心累积),单位:时钟节拍
    unsigned long getTotalCpuTime() {
        std::ifstream statFile("/proc/stat");
        if (!statFile.is_open()) {
            return 0;
        }

        std::string cpuLabel;
        unsigned long user=0, nice=0, system=0, idle=0;
        unsigned long iowait=0, irq=0, softirq=0, steal=0;

        /* 读取第一行,如 "cpu  <user> <nice> <system> <idle> <iowait> <irq> <softirq> <steal> ..." */
        statFile >> cpuLabel
                 >> user >> nice >> system >> idle
                 >> iowait >> irq >> softirq >> steal;

        // 注意:后续还有 guest 等字段,这里略过
        unsigned long totalJiffies = user + nice + system + idle
                                   + iowait + irq + softirq + steal;
        return totalJiffies;
    }
};
如果要对其再作优化,可以维护全局的文件句柄,使用时按需读取;同时文件解析的逻辑也可以自己实现,这里不多作赘述。
统计耗时
代码执行耗时的测量就简单得多了。在C++11及以后的标准中,标准库已经提供了<chrono>时间库,可以方便地获取高精度的时间点。这部分的实现原理就不多介绍了,直接上代码:
#include <chrono>
#include <cstdint>

class ElapsedProfiler {
public:
    void start() {
        m_running = true;
        m_start = Clock::now();
    }

    // 返回毫秒
    double stopMs() {
        if (!m_running) {
            return 0.0;
        }
        auto end = Clock::now();
        m_running = false;
        std::chrono::duration<double, std::milli> ms = end - m_start;
        return ms.count();
    }

    bool running() const {
        return m_running;
    }

private:
    using Clock = std::chrono::high_resolution_clock;
    bool m_running = false;
    Clock::time_point m_start{ };
};
这里我使用了std::chrono::high_resolution_clock取得高精度的时间,其实如果为了测量毫秒级的函数耗时,没有必要使用特别高精度的时钟,这里仅供参考。
使用例程
不妨编写分别写一个计算密集的函数和一个挂起等待的函数,验证一下耗时和CPU占用率的计算是否准确。代码如下:
static void demo_cpu_heavy() {
    printf("=== 计算密集 ===\n");

    CpuProfiler cpu;
    ElapsedProfiler wall;

    cpu.start();
    wall.start();

    volatile uint64_t acc = 0;
    for (uint64_t i = 1; i <= 200000000ULL; ++i) {
        acc += (i * 2654435761ULL) ^ (acc >> 3);
    }

    const double elapsedMs = wall.stopMs();
    const auto r = cpu.stop();

    printf("acc=%llu\n", (unsigned long long)acc);
    printf("elapsed=%.3f ms, cpu=%.2f%%\n", elapsedMs, r);
}

static void demo_sleep() {
    printf("\n=== 挂起延时 ===\n");

    CpuProfiler cpu;
    ElapsedProfiler wall;

    cpu.start();
    wall.start();

    std::this_thread::sleep_for(std::chrono::milliseconds(800));

    const double elapsedMs = wall.stopMs();
    const auto r = cpu.stop();

    printf("elapsed=%.3f ms, cpu=%.2f%%\n", elapsedMs, r);
}

int main() {
    demo_cpu_heavy();
    demo_sleep();
    return 0;
}
程序输出如下:
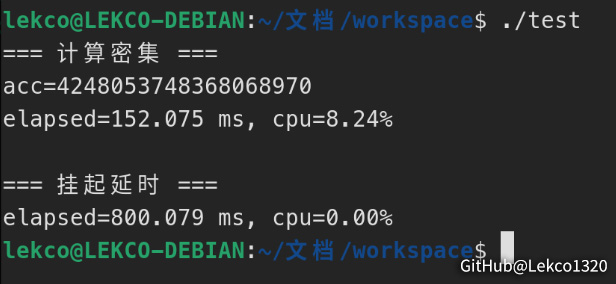
笔者电脑是六核十二线程,计算密集函数CPU占用率~8%,说明基本能跑满单线程;挂起延时的函数耗时接近800 ms,且CPU占用率几乎为零,说明结果符合预期,可以放心使用。

 浙公网安备 33010602011771号